
MIM Material Properties
You need reliable performance data for Metal Injection Molding components. This technical analysis provides quantitative mechanical, durability, and operational property data for MIM materials based on powder metallurgy physics and standardized testing protocols.
Why MIM Properties Differ from Wrought Materials
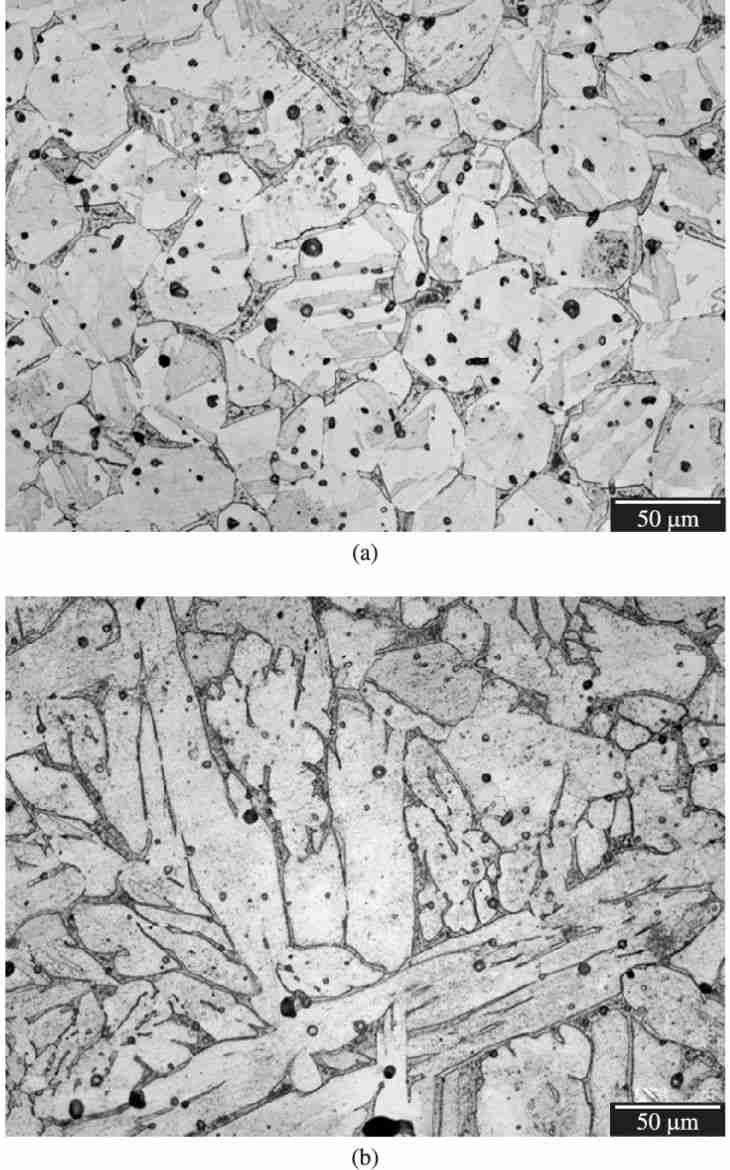
MIM components achieve95-98% theoretical density, with 2-5% residual porosity distributed as isolated, spherical pores (2-20 μm diameter). This single characteristic defines the performance difference.
The Good:Fine, equiaxed grain structure (ASTM 6-8) producesisotropic properties—strength is consistent in all directions.
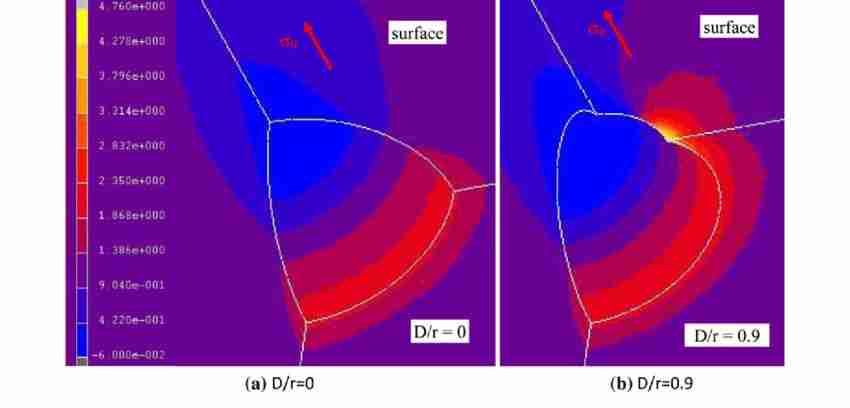
The Bad:Pores act as stress concentrators ($K_t = 2.0-2.5$), specifically reducing dynamic loading performance (Fatigue & Impact).
Mechanical Strength Properties
1. Tensile Strength (Static)
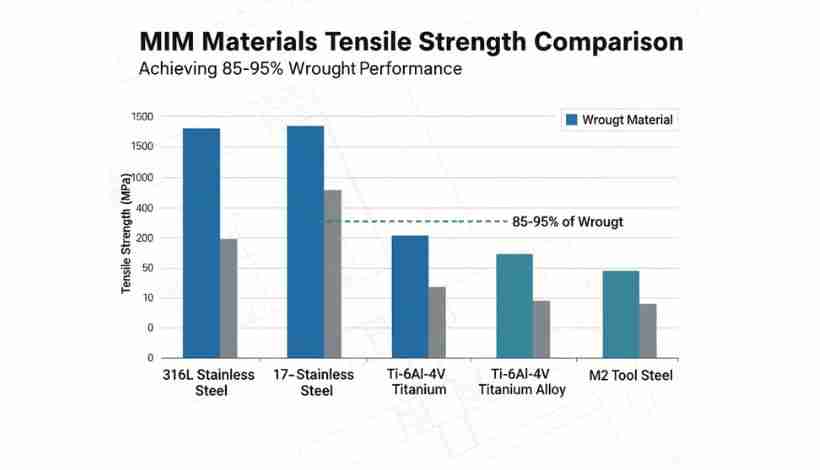
MIM generally retains85-95%of wrought tensile strength. The reduction correlates directly with porosity volume.
| Material | MIM Tensile (MPa) | Wrought Tensile (MPa) | Performance Ratio |
|---|---|---|---|
| 316L Stainless | 450 - 550 | 515 - 620 | 87 - 92% |
| 17-4PH (H900) | 1,000 - 1,100 | 1,170 - 1,310 | 85 - 90% |
| Low Alloy (Fe-2Ni) | 500 - 700 | 590 - 760 | 85 - 92% |
| Titanium (Ti-6Al-4V) | 900 - 1,000 | 950 - 1,050 | 90 - 95% |
2. Yield Strength & Hardness
Yield Strength
Retention: 90-95% of Wrought
Elastic deformation is less sensitive to porosity. 17-4PH H900 can reach 1,000 MPa yield.
Hardness
Retention: 100% (Equivalent)
Surface hardness matches near-full density materials. 17-4PH H900 typically hits 36-40 HRC.
3. Fatigue Strength: The Critical Limitation
⚠️ Fatigue Limit ≈ 35-45% of Tensile Strength
Unlike wrought materials (45-55%), MIM's fatigue limit is lower due to sub-surface pores initiating micro-cracks.
| Material | Tensile Strength | Varies |
|---|---|---|
| 17-4PH H900 | 1,050 MPa | 400 - 470 MPa |
| 316L | 500 MPa | 200 - 225 MPa |
| Ti-6Al-4V | 950 MPa | 380 - 430 MPa |
💡 Pro Tip:Polishing surfaces from Ra 1.6μm to 0.4μm can improve fatigue life by50-100%.
4. Impact Toughness
MIM retains70-85%of wrought impact toughness. High strain-rates concentrate stress waves at pores, causing brittle fracture initiation.
- 316L:80-120 J (70-80% of wrought)
- 17-4PH:20-35 J (67-78% of wrought)
Durability Properties
1. Wear Resistance
Wear resistance correlates with surface hardness. Closed porosity at 95-98% density prevents lubricant loss and debris entrapment.
| Material | Hardness | Sliding Wear Coefficient (k) |
|---|---|---|
| Carburized Fe-2Ni | 62 HRC | 0.4 - 0.8 × 10⁻⁶mm³/N·m |
| 17-4PH H900 | 38 HRC | 1.2 - 1.8 × 10⁻⁶mm³/N·m |
| 316L | 80 HRB | 4.5 - 6.5 × 10⁻⁶mm³/N·m |
Note: Wear rates are within 10-15% of machined equivalents.
2. Corrosion Resistance
Critical Threshold:Density must exceed95%. Below this, interconnected porosity creates crevice corrosion pathways, reducing resistance by 40-60%.
316L (Excellent)
- Pitting Potential:>600 mV vs. SCE
- Salt Spray:>1,000 hours
- Verdict:Equivalent to wrought.
17-4PH (Good)
- Pitting Potential:400-500 mV vs. SCE
- Salt Spray:500-800 hours
- Verdict:Inferior to 316L, matches wrought 17-4PH.
3. Corrosion Fatigue & Creep
The combination of mechanical stress and corrosive environment accelerates failure.
- Fatigue Reduction:Seawater reduces 316L fatigue limit by~29%(225 MPa $\rightarrow$ 160 MPa).
- Creep Resistance:Fine grain structure (ASTM 6-8) offers moderate advantages at 400-550°C.
Performance Under Operating Conditions
1. High-Temperature Strength Retention
Temperature profoundly affects strength. Here is the retention percentage relative to Room Temperature (RT):
| Material | 200°C Retention | 400°C Retention | 600°C Retention | Max Service Temp |
|---|---|---|---|---|
| 316L | 86% | 70% | 40% | 500°C |
| 17-4PH | 86% | 62% | Softens | 350°C |
| Ti-6Al-4V | 89% | 74% | 58% | 550°C |
2. Cryogenic Performance
❄️ 316L (Austenitic)
Excellent.No ductile-to-brittle transition.
- At -196°C (LN₂): Strength increases to 750 MPa.
- Elongation remains >28%.
- Impact energy >80 J.
❄️ 17-4PH / Fe-2Ni
Unsuitable.Exhibits brittle transition.
- Transition Temp: -40°C to -60°C.
- Below this, impact toughness drops to <15 J.
- Risk:Catastrophic brittle fracture.
3. Physical Properties (Thermal & Electrical)
| Material | Thermal Conductivity (W/m·K) | Expansion Coeff. (×10⁻⁶/°C) | Electrical Resistivity (μΩ·cm) |
|---|---|---|---|
| 316L | 16 | 16.5 | 72-75 |
| 17-4PH | 19 | 10.8 | 65-70 |
| Ti-6Al-4V | 7.5 (Insulator-like) | 8.6 (Stable) | 170-180 |
| Copper | 280-320 (Conductive) | - | 1.7-2.5 |
4. Magnetic Properties
MIM density (95-98%) ensures magnetic performance is within 5% of wrought.
- Non-Magnetic:316L (μr≈ 1.02). Ideally suited for MRI environments.
- Ferromagnetic:17-4PH (μr= 50-200).
- Soft Magnetic:Fe-50Ni (Bs= 1.55 T, Hc= 4-8 A/m). Ideal for actuators/sensors.
Video: Comprehensive overview of the Metal Injection Molding process (MPIF).
The Density-Property Relationship
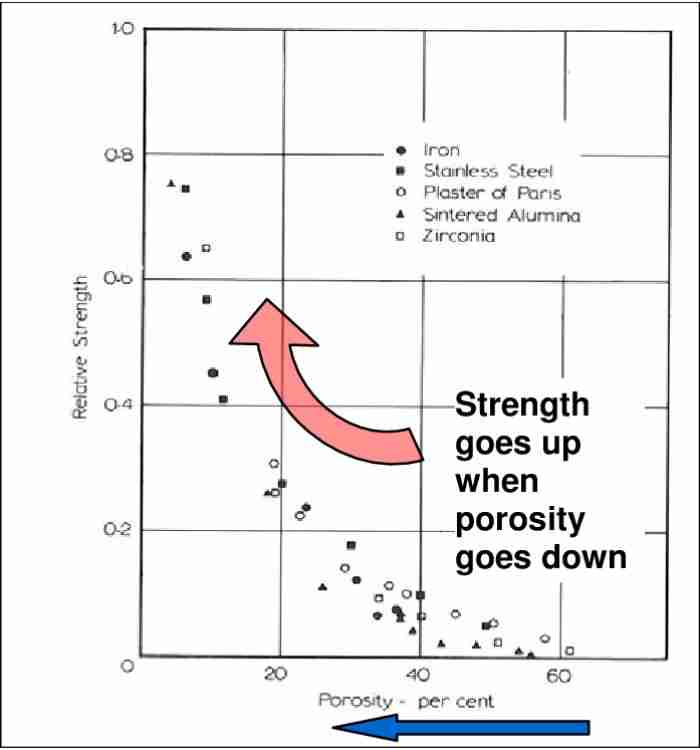
Achieved density is the primary determinant of MIM material properties. The exponential relationship demonstrates why density control is crucial.
Property Scaling Matrix
Notice the dramatic drop in performance below the critical 95% threshold.
| Density Level | Tensile Strength | Fatigue Strength | Porosity Structure | Corrosion |
|---|---|---|---|---|
| 97-98% (Optimal) | 90-95% | 75-80% | Isolated Spheres | Equivalent |
| 95-96% (Standard) | 85-90% | 70-75% | Minimal Interconnection | Equivalent |
| 92-94% (Marginal) | 75-85% | 60-70% | Partial Interconnection | -15 to 25% |
| <91% (Poor) | <75% | <60% | Open Network | Compromised |
The Critical Transition (94-95% Density):
- Above 95%:Pores are isolated. Impermeable to fluids. No internal corrosion.
- Below 94%:Pores connect. Fluids enter. Crevice corrosion starts.
Material-Specific Property Summary
Comparative Performance Matrix
Compare the relative strengths of common MIM alloys to select the right material for your application.
| Property | 316L | 17-4PH H900 | Fe-2Ni | Ti-6Al-4V |
|---|---|---|---|---|
| Tensile Strength | ★★★☆☆ | ★★★★★ | ★★★★☆ | ★★★★★ |
| Yield Strength | ★★☆☆☆ | ★★★★★ | ★★★★☆ | ★★★★★ |
| Ductility | ★★★★★ | ★★☆☆☆ | ★★★☆☆ | ★★★☆☆ |
| Fatigue Resistance | ★★☆☆☆ | ★★★★☆ | ★★★☆☆ | ★★★★☆ |
| Corrosion Resistance | ★★★★★ | ★★★☆☆ | ★☆☆☆☆ | ★★★★★ |
| Wear Resistance | ★★☆☆☆ | ★★★★☆ | ★★★★★ | ★★★☆☆ |
| Strength-to-Weight | ★★☆☆☆ | ★★☆☆☆ | ★★☆☆☆ | ★★★★★ |
| Biocompatibility | ★★★★☆ | ★★☆☆☆ | ★☆☆☆☆ | ★★★★★ |
Conclusion
MIM materials achieve85-95% of wrought material static strengthwith95-98% theoretical density. The fine, equiaxed grain structure provides isotropic properties with consistent performance in all directions.
Performance Retention vs. Wrought
Corrosion & Thermal
Tensile & Yield
Fatigue Limit
Material Selection Guide
316L Stainless
Choose for maximumCorrosion ResistanceandDuctility.
17-4PH H900
Choose for maximumStatic StrengthandHardness.
Fe-2Ni
Choose forWear Resistance(Heat Treated) andCost.
Ti-6Al-4V
Choose forStrength-to-WeightandBiocompatibility.
Note:Understanding the density-property relationship—particularly the critical threshold at 95-96% density where isolated porosity transitions to interconnected networks—enables accurate performance prediction.
Frequently Asked Questions
Q: Why does MIM achieve 90% of tensile strength but only 75% of fatigue strength?
The culprit is Stress Concentration Factors (Kt). Fatigue is uniquely sensitive to local defects rather than bulk volume. Under tensile loading, the bulk material yields and redistributes stress around pores. Under cyclic loading, however, 2-5% porosity creates stress risers (Kt = 2.0 - 2.5) at pore surfaces. Micro-cracks initiate here at 20-30% lower stress than bulk yielding predicts. The result is a disproportionate reduction in fatigue life compared to static strength.
Q: At what density does porosity affect corrosion resistance?
The critical transition occurs at 94-95% theoretical density. Below this, pores connect to form channels (crevice corrosion sites). At >95% density, pores are isolated spheres, and performance matches wrought (>600 mV pitting potential). At 93% density, interconnected pores start to form, resulting in reduced performance (400-450 mV pitting potential). At 90% density, an open network forms, creating a high risk (3-5x corrosion rate).
Q: How much does temperature reduce MIM material strength?
MIM alloys follow linear reduction trends identical to wrought materials; porosity does not increase temperature sensitivity. At 200°C, strength retention is 86% for 316L, 86% for 17-4PH, and 89% for Ti-6Al-4V. At 400°C, retention is 70% for 316L, 62% for 17-4PH (which over-tempers above this point), and 74% for Ti-6Al-4V. At 600°C, retention drops to 40% for 316L and 58% for Ti-6Al-4V (not applicable for 17-4PH).
Q: Do MIM parts have the same elastic modulus as wrought parts?
Yes, they are nearly identical (97-98%). Stiffness depends on atomic bonding, not microstructure. The 2-3% reduction in modulus corresponds strictly to the reduction in cross-sectional area due to porosity. Engineering Takeaway: You can use standard wrought stiffness values for deflection calculations.
Q: Does MIM maintain property uniformity throughout complex shapes?
Yes. This is a key advantage over Press-and-Sinter PM. In MIM (Fluid Injection), hydraulic pressure ensures uniform density packing, resulting in low property variation (±3-5%). In contrast, Wrought/Forged parts often show directional grain flow differences with a higher variation (±10-15%).
Custom MIM Parts from Emitech
Nanjing Emitech delivers MIM 316L, 17-4PH, 4340 and other materials from tooling through sintering and finishing. Custom MIM parts · MIM services · Request a quote
Last updated: 2026-06-26
Continue reading
- Metal Injection Molding Design: How to Optimize Parts for Manufacturing
- Improving hole and slot designs in metal injection molding (MIM) can reduce costs and make manufacturing easier
- Mixing and Kneading of Metal Injection Molding (MIM) Raw Materials: The Process Guide
- How Do MIM Material Properties Compare to Wrought Materials?