
Powder Compaction in Powder Metallurgy
Compaction is one of the most influential steps in powder metallurgy: pressure distribution, density gradients, and tooling dynamics directly control green strength, dimensional accuracy, and final part quality. This article covers the compaction process in technical detail.
Process Overview Video
Conventional Press-and-Sinter Powder Metallurgy
Source: Metal Powder Industries Federation (MPIF) | Duration: 11:47
This demonstration from MPIF shows the complete powder metallurgy process, including compaction stages in industrial production environments.
The Compaction Process: Four Stages
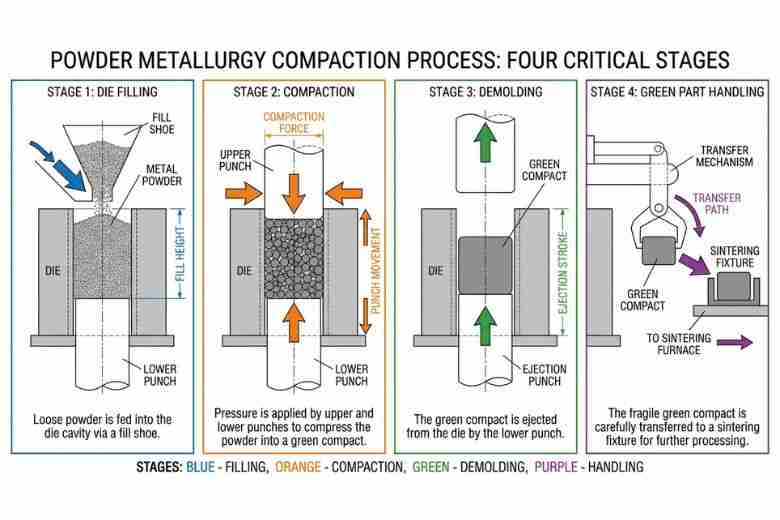
Figure 1: The Four Critical Stages of Powder Metallurgy CompactionSequential stages of the PM compaction process from powder filling through green compact handling. Each stage impacts final part quality and density uniformity.
Stage 1: Die Filling
Die filling determines final part density uniformity. Poor filling creates density variations that pressure cannot correct afterward.
Target afill ratioof 2.5-3.0 times the final green compact height. Optimizepowder flow ratefor Hausner ratio below 1.25. Setfill speedbetween 50-150 mm/s depending on powder characteristics. For reactive materials, maintainatmospheric oxygenbelow 100 ppm.
| Powder Characteristic | Impact on Die Filling | Optimization Strategy |
|---|---|---|
| Apparent density | Affects fill height consistency | Control ±0.02 g/cm³ variation |
| Particle size distribution | Influences flow and packing | Target D50: 50-150 μm for most applications |
| Shape factor | Determines interlock | Spherical: better flow; Irregular: better green strength |
| Surface condition | Affects flow | Maintain moisture < 0.2% |
Segregationcauses 15-20% density variation in multi-component powders. Use shorter fill heights and implement vibration-assisted filling to correct this.Bridgingresults in incomplete cavity filling. Optimize die design with draft angles above 3° and use fill shoes with controlled vibration.
Stage 2: Compaction - Pressure Application
Compaction transforms powder particles through plastic deformation, work hardening, and cold welding. The pressure-density relationship is non-linear and material-specific.
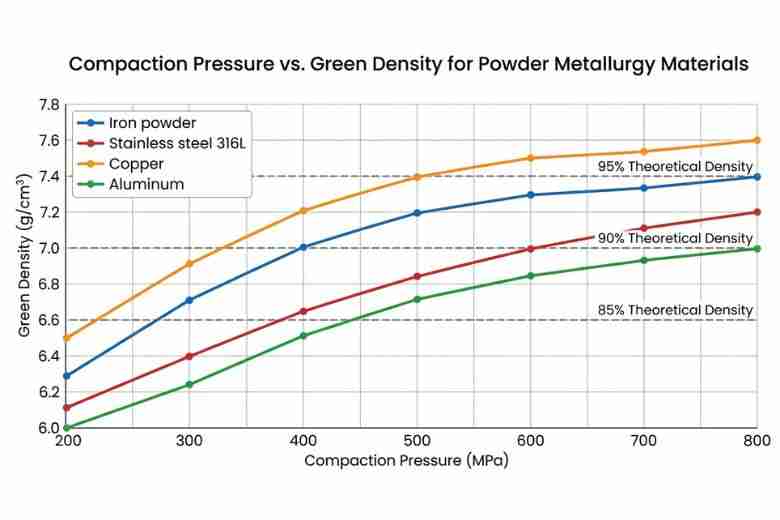
Figure 2: Compaction Pressure vs. Green Density Curve for Common PM MaterialsMaterial-specific compaction curves demonstrate the non-linear relationship between applied pressure and achieved green density. Iron-based powders typically require 400-600 MPa for optimal densification.
| Compaction Pressure (MPa) | Green Density (g/cm³) | % Theoretical Density | Typical Applications |
|---|---|---|---|
| 300-400 | 6.6-6.8 | 84-87% | Low-stress components |
| 400-500 | 6.8-7.0 | 87-89% | Standard industrial parts |
| 500-600 | 7.0-7.2 | 89-92% | High-performance components |
| 600-800 | 7.2-7.5 | 92-95% | Critical applications |
Double-action pressingreduces density gradients by 40-60% but increases tooling cost by 30-50%. This technique is essential for L/D ratios above 2.5.Warm compactionat 130-150°C increases green density by 0.2-0.4 g/cm³ and reduces spring-back by 25-35%, but requires specialized heating systems.High-velocity compactionapplies pressure in 10-50 ms, which improves particle bonding through dynamic effects and suits brittle materials.
For cylindrical parts, density variation follows this relationship: ρ(h) = ρ_max × exp(-μ × 4h/D), where ρ(h) is density at height h, μ is wall friction coefficient (0.08-0.15 for lubricated dies), D is diameter, and h is distance from pressure source.
Stage 3: Demolding - Ejection Mechanics
Ejection force calculation prevents defects: F_ejection = π × D × h × τ × (1 + K × tan φ), where τ is shear stress at die wall (2-5 MPa typical), K is lateral pressure coefficient (0.3-0.5), and φ is angle of friction.
| Parameter | Recommended Range | Critical Threshold |
|---|---|---|
| Ejection speed | 20-80 mm/s | >100 mm/s causes end-capping |
| Ejection force | <70% compaction force | >80% indicates lubrication issues |
| Green strength | 3-8 MPa | <2 MPa risks handling damage |
| Spring-back | 0.1-0.3% | >0.5% indicates pressure issues |
To preventend-capping, reduce ejection speed to 30-50 mm/s and increase lubricant by 0.2-0.3%.Laminationrequires staged pressure release (50% → 0% over 0.5-1.0 seconds).Die wall adhesionrequires maintaining die surface roughness Ra below 0.4 μm.
Stage 4: Green Part Handling
| Production Volume | Part Complexity | Recommended System | Investment Level |
|---|---|---|---|
| <500 pcs/day | Simple | Manual with fixtures | Varies |
| 500-5,000 pcs/day | Medium | Semi-automated | Varies |
| 5,000-50,000 pcs/day | Any | Fully automated | Varies |
| >50,000 pcs/day | Standard | High-speed robotic | Varies |
Safety-critical parameters includeABS response timebelow 50 ms,dust extractionmaintaining below 5 mg/m³ in work area, anddrop height tolerancebelow 10 mm for standard parts (below 5 mm for precision components).
Compaction Methods: Technical Comparison
Die Compaction - High-Volume Production
Die compaction achievesproduction ratesof 30-60 parts/minute for mechanical presses and 15-30 parts/minute for hydraulic presses.Dimensional toleranceranges from ±0.05-0.15 mm.Surface finishreaches Ra 1.6-6.3 μm.Density uniformityshows ±2-5% variation.
Critical tooling design parameters includepunch-to-die clearanceof 0.02-0.05 mm, which prevents powder leakage while allowing smooth motion.Core rod stabilityrequires deflection below 0.01 mm for L/D above 5.Die stress analysismust keep stress below 60% of tool material yield strength.
Die compaction suits parts with L/D ratio below 3.0, production volumes above 10,000 units per year, and tolerance requirements of ±0.1 mm or wider.
Cold Isostatic Pressing (CIP)
| Parameter | Standard CIP | Advanced CIP |
|---|---|---|
| Pressure range | 100-400 MPa | 400-600 MPa |
| Pressure uniformity | ±1-2% | ±0.5-1% |
| Cycle time | 5-15 minutes | 3-8 minutes |
| Green density uniformity | ±0.5-1% | ±0.2-0.5% |
CIP eliminates directional density gradients, enables complex geometries (hollows, threads, undercuts), and reduces residual stresses by 70-80% versus die compaction. Dimensional tolerance ranges from ±0.5-1.5%, which requires post-processing for precision. Production rate reaches 4-12 parts per hour. Elastomeric tooling lasts 100-500 cycles.
Hot Isostatic Pressing (HIP)
HIP operates attemperatureof 0.7-0.8 × T_melting (typically 900-1,300°C for steels),pressureof 100-200 MPa,hold timeof 2-4 hours, andatmosphereof argon at 99.999% purity.
| Property | HIP vs. Sintered Only | Improvement |
|---|---|---|
| Relative density | 99.5-100% vs. 92-96% | +4-8% |
| Tensile strength | +15-25% | Significant |
| Fatigue life | +200-400% | Dramatic |
| Porosity | <0.1% vs. 3-8% | Near elimination |
Equipment cost is substantial. Operating cost runs low per kg processed. HIP justifies its cost for aerospace, medical implants, and critical tooling applications.
Equipment Selection and Specifications
Mechanical vs. Hydraulic Presses
Mechanical presses generate force through flywheel energy stored and released through eccentric mechanism. The force-stroke curve is non-linear with maximum force at bottom dead center. Cycle time runs 1-3 seconds typically. Energy efficiency reaches 70-80% due to fewer hydraulic losses.
| Press Capacity | Slide Stroke | Production Rate | Power Requirement |
|---|---|---|---|
| 500 kN | 100-150 mm | 40-60 ppm | 15-25 kW |
| 1,000 kN | 150-200 mm | 35-50 ppm | 30-45 kW |
| 2,000 kN | 200-300 mm | 30-40 ppm | 55-75 kW |
Hydraulic presses generate force through hydraulic cylinder with programmable control. The force-stroke curve delivers constant force throughout stroke. Cycle time runs 3-6 seconds typically. Pressure control achieves ±1-2% precision. Advanced features include multi-stage pressure profiles (3-5 stages typical), position-dependent pressure control, and real-time density monitoring via servo feedback.
Process Optimization: Technical Strategies
Powder Characterization and Control
Particle size distribution affects packing behavior. Narrow distribution (D90/D10 below 3) provides better packing but lower green strength. Broad distribution (D90/D10 above 5) achieves higher packing density but risks segregation. Optimal distribution is bimodal with 70% coarse plus 30% fine particles.
Flow characterization uses Hall flow rate targeting 25-35 seconds per 50g for standard applications. Carney flow suits poor-flowing powders. Angle of repose below 35° indicates excellent flow, while above 45° is problematic.
Green density relates to pressure and powder characteristics through: ρ_green = ρ_apparent + k × ln(P/P₀) × (1 - SF/100), where SF is shape factor (0-100, spherical equals 100), k is compressibility constant (material-dependent), and P₀ is reference pressure (typically 100 MPa).
Lubrication Systems
| Lubricant | Addition Level | Ejection Force Reduction | Burn-off Temp | Density Impact |
|---|---|---|---|---|
| Zinc stearate | 0.5-1.0% | 50-60% | 120-150°C | -0.10 g/cm³ |
| EBS (Ethylene bis-stearamide) | 0.5-0.75% | 55-65% | 140-180°C | -0.08 g/cm³ |
| Lithium stearate | 0.75-1.25% | 60-70% | 200-230°C | -0.12 g/cm³ |
| Amide wax | 0.3-0.6% | 45-55% | 160-190°C | -0.05 g/cm³ |
Die wall lubrication uses spray application at 0.1-0.3 g/m² coverage, with reapplication every 100-500 parts. Roll application provides more uniformity and suits high-speed production. Electrostatic application minimizes waste with precise control.
Start optimization with 0.75% internal lubricant. Measure ejection force, which should run below 70% of compaction force. Adjust in 0.1% increments. Monitor green density impact. Validate sintered properties with lubricant residue below 0.02%.
Density Uniformity: Advanced Techniques
For parts with varying cross-sections, implement compensating punch displacement: Δh = (A₁/A₂ - 1) × h₀, where Δh is differential punch travel, A₁ and A₂ are cross-sectional areas, and h₀ is nominal height.
| Feature | Density Improvement | Tooling Cost Increase | Complexity |
|---|---|---|---|
| Floating die | 20-30% reduction in variation | +15-25% | Medium |
| Stepped punches | 25-35% reduction | +20-30% | Medium |
| Withdrawal tooling | 30-40% reduction | +40-60% | High |
| Servo-controlled multi-axis | 40-50% reduction | +100-150% | Very high |
Quality Control: Measurement and Analysis
Green Density Measurement Methods
The geometric method (±0.5% accuracy) calculates ρ = m / (π × D²/4 × h). This method is fast and non-destructive but assumes perfect geometry and is sensitive to measurement errors.
The Archimedes method (±0.2% accuracy) uses ρ = (m_air / (m_air - m_liquid)) × ρ_liquid × (1 - P/100), where P equals open porosity percentage.
Mercury porosimetry (±0.1% accuracy) provides pore size distribution, measures both open and closed porosity, and is critical for understanding sintering behavior.
Green Strength Testing Protocols
Transverse rupture strength (TRS) uses 3-point bending on 31.75mm × 12.5mm × 6.35mm specimens. The calculation is TRS = (3 × F × L) / (2 × w × t²).
| Material System | Green TRS (MPa) | After Sintering (MPa) | Improvement Factor |
|---|---|---|---|
| Iron + 0.8% graphite | 6-9 | 350-450 | 50-60× |
| Bronze (Cu-10Sn) | 8-12 | 200-280 | 20-25× |
| Stainless steel 316L | 5-8 | 450-550 | 70-90× |
| WC-Co | 15-25 | 1,400-1,800 | 70-90× |
Common Defects and Troubleshooting
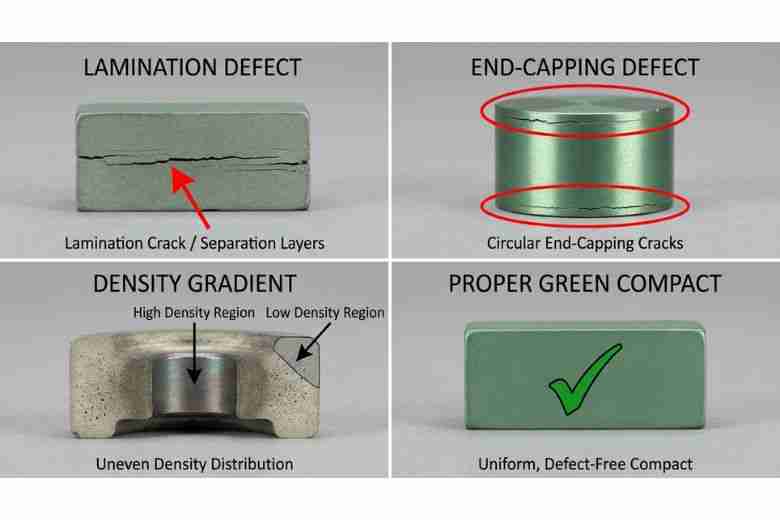
Figure 3: Common Powder Compaction Defects: Visual Identification GuideVisual guide to identifying common compaction defects. Left to right: lamination cracks (horizontal fractures), end-capping (circular edge cracks), density gradient (uneven appearance), and defect-free green compact.
Lamination Defects
Air entrapment during filling causes 60% of cases. Excessive lubricant causes 25% of cases. Rapid pressure application causes 15% of cases.
To diagnose, section green compact horizontally, measure density at crack location versus bulk, and analyze crack orientation relative to pressing direction.
| Severity | Density Variation | Solution |
|---|---|---|
| Minor | 2-5% | Reduce fill speed by 20%, improve venting |
| Moderate | 5-10% | Reduce lubricant by 0.2%, implement staged compression |
| Severe | >10% | Redesign tooling with evacuation channels, use warm compaction |
End-Capping Diagnosis
End-capping occurs when hoop stress σ_hoop = (E × ε_radial) / (1 - ν²) exceeds TRS.
Prevention requires ejection force below 50% of compaction force, chamfer die entrance (2-3 mm, 15-20° angle), polish die walls to Ra below 0.4 μm, and increase lubricant in end regions by 0.3-0.5%.
Density Gradient Troubleshooting
Section compact into 5-10 layers, measure density of each layer, and calculate density distribution coefficient: CDC = (ρ_max - ρ_min) / ρ_average × 100%.
CDC below 5% is excellent. CDC 5-8% is acceptable for standard applications. CDC 8-12% is marginal and may cause warping. CDC above 12% is unacceptable and requires redesign.
| CDC Range | Primary Action | Secondary Action |
|---|---|---|
| 5-8% | Implement double-action pressing | Optimize lubricant distribution |
| 8-12% | Use floating die + double-action | Consider warm compaction |
| >12% | Redesign part geometry | Switch to CIP if economically viable |
Frequently Asked Questions
Q: How do I calculate compaction pressure for my specific alloy?
Conduct compaction trials at 300, 400, 500, and 600 MPa, plot green density versus applied pressure, extrapolate to your target density, and add 10% safety margin. Use established compaction models such as the Heckel equation or Cooper-Eaton equation to fit your powder data, rather than a single universal equation.
Q: What is the relationship between green density and sintered properties?
For iron-based materials, sintered strength increases strongly with green density. As a rule of thumb, each 0.1 g/cm³ increase in green density can add approximately 50-80 MPa to ultimate tensile strength, depending on alloy and sintering conditions. Validate with tensile tests on production specimens. Dimensional change equals ((ρ_sintered / ρ_green) - 1) × 100%. At 6.8 g/cm³ green density, sintered density reaches 7.2 g/cm³ with -0.5% shrinkage and 380 MPa strength for Fe-0.8C. At 7.2 g/cm³ green density, sintered density reaches 7.6 g/cm³ with -2.0% shrinkage and 520 MPa strength.
Q: How do I select compaction equipment for a new production line?
Define requirements including annual production volume, part complexity (L/D ratio, features), tolerance requirements, and material system. For simple geometry with high volume, select mechanical press. For complex geometry with medium volume, select hydraulic press. For uniform properties required, select CIP. For near-full density critical applications, select HIP post-processing. Mechanical press at 500 kN carries a high capital cost with moderate per-part operating cost, breaking even above 50,000 parts yearly. Hydraulic press at 1000 kN carries a substantial capital cost with low per-part operating cost, breaking even above 30,000 parts yearly.
Q: What indicates press maintenance needs?
Monitor force variation every cycle using load cell. Warning threshold is ±3% from setpoint, critical threshold is ±5%. Monitor position repeatability using LVDT sensors. Warning threshold is ±0.05 mm, critical threshold is ±0.10 mm. Monitor ejection force trend, with warning at +15% over baseline and critical at +25%. Daily maintenance includes visual inspection and force/position verification. Weekly maintenance includes lubrication points and alignment check. Monthly maintenance includes die wear measurement and hydraulic filter check. Quarterly maintenance includes force calibration and tool steel hardness testing. Annual maintenance includes complete overhaul and seal replacement.
Q: How can I reduce powder waste in compaction?
Overfilling typically causes 2-5% waste. Optimize fill controls to ±1% for 50-70% reduction. Reject parts cause 1-3% waste. Statistical process control reduces this by 60-80%. Die cleaning causes 0.5-1% waste. Vacuum recovery systems achieve 80-90% recovery. Floor spillage causes 0.5-2% waste. Enclosed handling systems reduce this by 90%. Dust collection causes 1-2% waste with 50% recovery possible from filters. Segregate powder streams by contamination level, screen recovered powder through 100-mesh sieve, blend 10-20% recovered with virgin powder, test flow characteristics maintaining within ±10% of virgin, and track green strength to keep at or above 90% of virgin material.
Q: What causes spring-back and how do I compensate?
Spring-back follows ε_springback = (E × σ_residual) / E_effective. Iron powder shows 0.15-0.25% elastic recovery, 0.08-0.12% radial expansion, and 0.20-0.30% axial expansion. Stainless steel shows 0.25-0.35% elastic recovery, 0.12-0.18% radial expansion, and 0.30-0.45% axial expansion. Compensate through tooling design by overbuilding die cavity by spring-back percentage, pressure dwell by holding maximum pressure 1-3 seconds, warm compaction to reduce spring-back by 25-35%, or sizing operation through post-compaction re-pressing to final dimensions.
Q: How do environmental conditions affect compaction quality?
Maintain humidity at 30-60% RH. Below 30% causes static and powder flow issues, above 60% causes powder oxidation. Maintain temperature at 18-25°C. Variation of ±5°C causes density variation of 0.5-1%. Maintain powder temperature within ±2°C from setpoint, which affects lubricant effectiveness. Keep dust level below 5 mg/m³ to prevent health hazard and contamination. In winter low humidity, increase lubricant by 0.1-0.2%, ground equipment for static dissipation, and monitor powder flow. In summer high humidity, reduce lubricant by 0.1-0.2%, increase ventilation, check powder oxidation more frequently, and monitor tooling for rust.
Q: What production rates should I expect from different equipment?
High-end European and Japanese mechanical presses typically achieve 40-60 parts per minute with very high reliability and cost. Mid-range hydraulic and mechanical presses from established global manufacturers achieve 30-50 parts per minute at moderate to high cost. Entry-level presses may achieve 20-40 parts per minute with lower capital cost but require more frequent maintenance. Complex geometries reduce output by 20-40% compared to standard cylindrical components. Select based on required tolerance, volume, part complexity, and local service support.
Powder Metallurgy Compaction and MIM from Emitech
From die design and compaction to sintering and finishing, Emitech supports complex PM and MIM parts in high volumes. Custom MIM parts · Get a quote
Last updated: 2026-06-26