
Powder Metallurgy Sizing: Technical Process Guide and Optimization Strategies
Poor compaction accounts for 60–70% of all defects in powder metallurgy parts. Understanding what happens at each stage—and what the numbers should look like—is the difference between consistent yield and chronic rework.
Process Overview Video
Watch: Conventional Press-and-Sinter Powder Metallurgy
Source: Metal Powder Industries Federation (MPIF) | Duration: 11:47
The Compaction Process
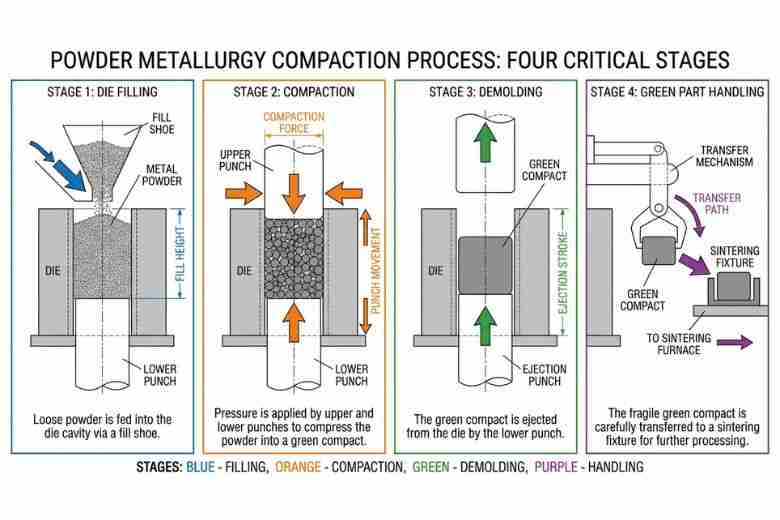
Sequential stages of the PM compaction process from powder filling through green compact handling.
Stage 1: Die Filling
Die filling determines density uniformity across the finished part. Density variations introduced here cannot be corrected by pressure downstream.
Key parameters to control:
- Fill ratio:2.5–3.0× the final green compact height
- Powder flow:Hausner ratio below 1.25
- Fill speed:50–150 mm/s depending on powder characteristics
- Atmosphere:oxygen below 100 ppm for reactive materials
| Powder Characteristic | Impact | Target |
|---|---|---|
| Apparent density | Fill height consistency | Variation ≤ ±0.02 g/cm³ |
| Particle size (D50) | Flow and packing | 50–150 μm for most applications |
| Particle shape | Flow vs. green strength | Spherical = better flow; Irregular = better green strength |
| Moisture | Flow and oxidation | Below 0.2% |
Segregation in multi-component powders causes 15–20% density variation. Shorter fill heights and vibration-assisted filling both reduce this. Bridging (incomplete cavity fill) is corrected through draft angles above 3° and controlled vibration on the fill shoe.
Stage 2: Compaction
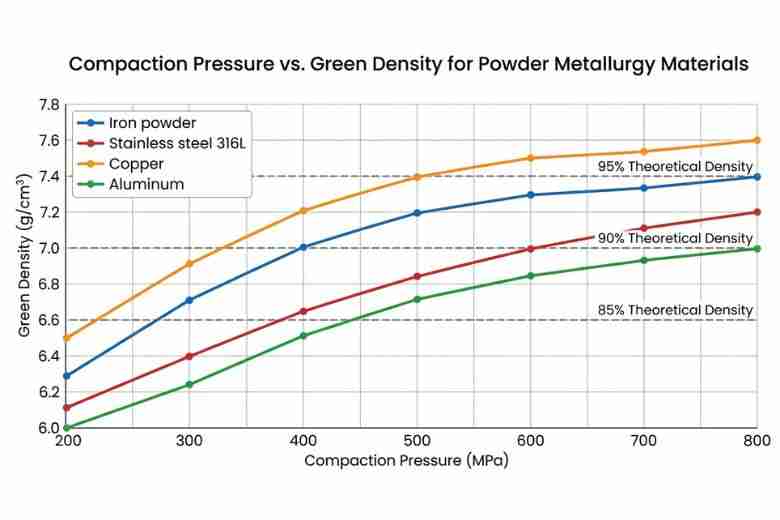
Compaction curves for common PM materials. Iron-based powders typically require 400–600 MPa for optimal densification.
Pressure transforms powder particles through plastic deformation and cold welding. The pressure-density relationship is non-linear and material-specific—what works for iron won't work for stainless.
Pressure-Density Reference: Iron-Based Powders
| Compaction Pressure (MPa) | Green Density (g/cm³) | % Theoretical Density | Typical Use |
|---|---|---|---|
| 300–400 | 6.6–6.8 | 84–87% | Low-stress components |
| 400–500 | 6.8–7.0 | 87–89% | Standard industrial parts |
| 500–600 | 7.0–7.2 | 89–92% | High-performance components |
| 600–800 | 7.2–7.5 | 92–95% | Critical applications |
Three advanced compaction approaches address specific production challenges:
- Double-action pressing:Reduces density gradients 40–60% by pressing from both ends. Tooling costs increase 30–50%. Essential for parts with length-to-diameter ratio above 2.5.
- Warm compaction (130–150°C):Increases green density by 0.2–0.4 g/cm³ and reduces spring-back 25–35%. Requires heated tooling and feed systems.
- High-velocity compaction:Applies pressure in 10–50 milliseconds. Improves particle bonding, particularly useful for brittle materials.
Stage 3: Demolding
Ejection is where green parts are most vulnerable. The target: eject cleanly without cracking, end-capping, or surface damage.
| Parameter | Target Range | Problem Threshold |
|---|---|---|
| Ejection speed | 20–80 mm/s | >100 mm/s causes end-capping |
| Ejection force | <70% of compaction force | >80% indicates lubrication problems |
| Green strength | 3–8 MPa | <2 MPa risks handling damage |
| Spring-back | 0.1–0.3% | >0.5% indicates pressure issues |
Common ejection problems and fixes:
- End-capping:Reduce ejection speed to 30–50 mm/s; increase lubricant by 0.2–0.3%
- Lamination:Implement staged pressure release from 50% to 0% over 0.5–1.0 seconds
- Die wall adhesion:Maintain die surface roughness Ra below 0.4 μm
Stage 4: Green Part Handling
| Production Volume | Part Complexity | Recommended System |
|---|---|---|
| <500 pcs/day | Simple | Manual with fixtures |
| 500–5,000 pcs/day | Medium | Semi-automated |
| 5,000–50,000 pcs/day | Any | Fully automated |
| >50,000 pcs/day | Standard | High-speed robotic |
Drop height limits: below 10 mm for standard parts, below 5 mm for precision components.
Compaction Methods Compared
Die Compaction
The standard method for high-volume PM production.
- Production rate:30–60 parts/min (mechanical press); 15–30 parts/min (hydraulic)
- Dimensional tolerance:±0.05–0.15 mm
- Surface finish:Ra 1.6–6.3 μm
- Density uniformity:±2–5%
Best suited for: length-to-diameter ratio below 3.0, volumes above 10,000 units/year, tolerance requirements of ±0.1 mm or wider.
Cold Isostatic Pressing (CIP)
CIP applies pressure uniformly from all directions, eliminating the directional density gradients that die compaction produces. Used when geometry or property requirements exceed what die compaction can deliver.
| Parameter | Standard CIP | Advanced CIP |
|---|---|---|
| Pressure range | 100–400 MPa | 400–600 MPa |
| Green density uniformity | ±0.5–1% | ±0.2–0.5% |
| Cycle time | 5–15 min | 3–8 min |
| Production rate | 4–12 parts/hour | |
Tradeoffs: dimensional tolerance of ±0.5–1.5% requires post-processing for tight fits; elastomeric tooling lasts only 100–500 cycles.
Hot Isostatic Pressing (HIP)
HIP is a post-sintering operation that eliminates residual porosity sintering alone cannot close.
| Property | Sintered Only | After HIP | Improvement |
|---|---|---|---|
| Relative density | 92–96% | 99.5–100% | +4–8% |
| Tensile strength | Baseline | +15–25% | Significant |
| Fatigue life | Baseline | +200–400% | Dramatic |
| Porosity | 3–8% | <0.1% | Near elimination |
HIP requires high capital and operating costs; it is justified only for aerospace, medical implants, and critical tooling where porosity-related fatigue failure is unacceptable.
Equipment Selection
| Press Type | Capital Cost | Operating Cost/Part | Best For |
|---|---|---|---|
| Mechanical (500 kN) | Low–moderate | Low | Simple geometry, high volume (50,000+/yr) |
| Hydraulic (1,000 kN) | Moderate | Low | Complex geometry, medium volume (30,000+/yr) |
| CIP system | Moderate | Moderate | Uniform density required, low volume |
| HIP system | High | High | Critical applications only |
Mechanical presses suit simple geometries at high volume—1–2 second cycle times and 70–80% energy efficiency make them the default choice. Hydraulic presses offer programmable multi-stage pressure profiles and constant force throughout the stroke, which matters for complex cross-sections.
Process Optimization
Lubrication
Every lubricant reduces green density—the question is how much, and whether the ejection benefit justifies it.
| Lubricant | Addition Level | Ejection Force Reduction | Density Impact | Burn-off Temp |
|---|---|---|---|---|
| Zinc stearate | 0.5–1.0% | 50–60% | −0.10 g/cm³ | 120–150°C |
| EBS | 0.5–0.75% | 55–65% | −0.08 g/cm³ | 140–180°C |
| Lithium stearate | 0.75–1.25% | 60–70% | −0.12 g/cm³ | 200–230°C |
| Amide wax | 0.3–0.6% | 45–55% | −0.05 g/cm³ | 160–190°C |
Starting point: 0.75% internal lubricant. Measure ejection force—target below 70% of compaction force. Adjust in 0.1% increments and verify green density after each change. Lubricant residue in sintered parts should stay below 0.02%.
Density Uniformity
| Technique | Density Improvement | Tooling Cost Increase |
|---|---|---|
| Floating die | 20–30% variation reduction | +15–25% |
| Stepped punches | 25–35% reduction | +20–30% |
| Withdrawal tooling | 30–40% reduction | +40–60% |
| Servo-controlled multi-axis | 40–50% reduction | +100–150% |
Quality Control
Green Density Measurement
| Method | Accuracy | Notes |
|---|---|---|
| Geometric | ±0.5% | Fast, non-destructive; assumes perfect geometry |
| Archimedes | ±0.2% | Accounts for open porosity; standard production method |
| Mercury porosimetry | ±0.1% | Full pore size distribution; used for process development |
Green Strength by Material
| Material System | Green TRS (MPa) | After Sintering (MPa) |
|---|---|---|
| Iron + 0.8% graphite | 6–9 | 350–450 |
| Bronze (Cu-10Sn) | 8–12 | 200–280 |
| Stainless steel 316L | 5–8 | 450–550 |
| WC-Co | 15–25 | 1,400–1,800 |
Common Defects and Troubleshooting
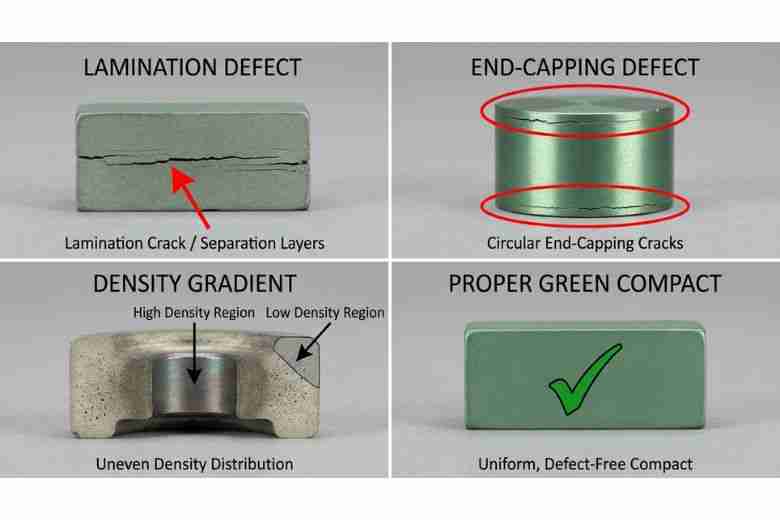
Common compaction defects: lamination cracks, end-capping, density gradient variations, and a defect-free reference compact.
Lamination
Root causes: air entrapment during filling (60% of cases), excessive lubricant (25%), rapid pressure application (15%).
| Severity | Density Variation | Action |
|---|---|---|
| Minor | 2–5% | Reduce fill speed 20%, improve venting |
| Moderate | 5–10% | Reduce lubricant 0.2%, implement staged compression |
| Severe | >10% | Redesign tooling with evacuation channels; consider warm compaction |
End-Capping
Caused by excessive elastic recovery during ejection. Prevention:
- Keep ejection force below 50% of compaction force
- Chamfer die entrance 2–3 mm at 15–20°
- Polish die walls to Ra below 0.4 μm
- Increase lubricant in end regions by 0.3–0.5%
Density Gradients
Measure the Density Distribution Coefficient (CDC) by sectioning the compact into 5–10 layers and comparing max to min density:
| CDC Range | Status | Action |
|---|---|---|
| <5% | Excellent | No action required |
| 5–8% | Acceptable | Implement double-action pressing; optimize lubricant |
| 8–12% | Marginal | Floating die + double-action; consider warm compaction |
| >12% | Unacceptable | Redesign geometry; switch to CIP if economically viable |
Frequently Asked Questions
Q: What compaction pressure do I need for my material?
Target pressure depends on material and required density. For iron-based powders: 400–500 MPa achieves standard industrial density (6.8–7.0 g/cm³); 500–600 MPa for high-performance parts (7.0–7.2 g/cm³). Stainless steel 316L requires higher pressure—around 560 MPa to reach equivalent density. Copper and bronze compact more easily at 380–450 MPa.
When working with a new material, run compaction tests at 300, 400, 500, and 600 MPa, plot the resulting densities, then add a 10% safety margin for production.
Q: How does green density affect sintered part strength?
Every 0.1 g/cm³ increase in green density produces roughly 50–80 MPa improvement in sintered tensile strength for iron-based materials. For Fe-0.8C as a reference:
| Green Density (g/cm³) | Sintered Density (g/cm³) | Tensile Strength (MPa) |
|---|---|---|
| 6.8 | 7.2 | 380 |
| 7.0 | 7.4 | 450 |
| 7.2 | 7.6 | 520 |
| 7.4 | 7.8 | 600 |
Higher green density also increases sintering shrinkage—factor this into dimensional tolerance planning.
Q: How do I reduce powder waste in compaction?
Typical waste sources and realistic reduction targets:
- Overfilling (2–5% loss):Optimized fill controls reduce this 50–70%
- Reject parts (1–3%):Statistical process control cuts this 60–80%
- Floor spillage (0.5–2%):Enclosed handling systems recover 90%
- Dust collection (1–2%):Filter reclamation recovers around 50%
Recovered powder can be blended back at 10–20% with virgin material if it passes flow rate (within ±10% of virgin) and green strength checks (minimum 90% of virgin). Properly managed, total waste drops from a typical 5–13% to below 2%.
Q: What causes spring-back and how do I compensate?
Spring-back is elastic recovery after pressure release. Values by material:
| Material | Radial Expansion | Axial Expansion |
|---|---|---|
| Iron powder | 0.08–0.12% | 0.20–0.30% |
| Stainless steel | 0.12–0.18% | 0.30–0.45% |
| Copper | 0.05–0.08% | 0.15–0.22% |
| Hard alloys | 0.15–0.25% | 0.40–0.60% |
Compensation options: overbuild the die cavity by the expected spring-back percentage; hold maximum pressure 1–3 seconds before ejection; use warm compaction (reduces spring-back 25–35%); or add a sizing operation (post-compaction re-pressing to final dimensions).
Q: How do environmental conditions affect compaction quality?
- Humidity:Keep 30–60% RH. Below 30% causes static and flow problems; above 60% promotes powder oxidation.
- Temperature:Hold 18–25°C. A ±5°C swing causes 0.5–1% density variation.
Seasonal adjustments: in dry winter conditions, increase lubricant 0.1–0.2% and monitor powder flow. In humid summer conditions, reduce lubricant 0.1% and increase ventilation. Managed consistently, seasonal variation stays below 3%.
Getting to World-Class Compaction
Defect rates below 2% and process capability (Cpk) above 1.67 are achievable with disciplined process control. The path is sequential—advanced techniques applied before basic stability is established waste time and tooling budget.
| Phase | Timeline | Key Actions | Expected Improvement |
|---|---|---|---|
| Baseline | Week 1–2 | Measure current capability, document defect types and frequency | Establish metrics |
| Quick wins | Week 3–6 | Optimize lubricant levels, improve die filling controls | 20–30% defect reduction |
| Process control | Week 7–12 | Implement SPC, upgrade tooling where CDC exceeds 8% | 40–50% defect reduction |
| Advanced | Month 4–6 | Warm compaction, automated green part handling | 60–70% defect reduction |
Precision Metal Parts from Emitech
Nanjing Emitech delivers MIM, CNC machining, and custom metal parts. MIM services · Request a quote
Last updated: 2026-06-24